WebFOCUS
Online Help > Creating Compound Reports With Power Painter > Controlling Report Overflow and Position of Objects > Using Flowing Overflow in Power Painter
Using Flowing Overflow in Power Painter
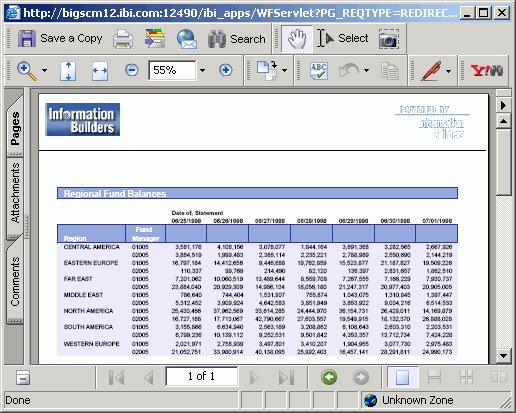
Reports using flowing overflow begin the report output
at the upper left corner of the report object and fill the page
with the report results. Flow margins are available which enable
you to adjust the canvas so that flowing objects fill the page.
Note: Flowing overflow is not available for graphs, images,
text, or lines. For example, if a graph is included in the document
and the graph overlaps the report at run time, you must set a relationship
between the graph and the report so the graph flows after the report
at run time.
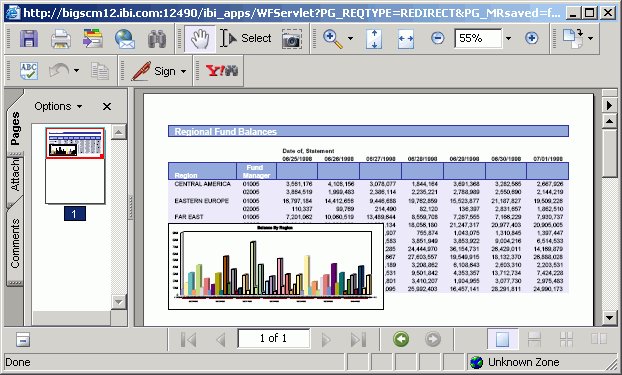
Procedure: How to Set the Flowing Report Property
-
Select an object from the Power Painter canvas.
The properties
palette shows the available properties for the selected object.
-
Select Flowing from
the Sizing and Overflow drop-down list.
Tip: Flow margins are available for the canvas,
which further enables you to adjust the page so that the report
fills each page between the flow margins. For more information about
flow margins, see How to Set Flow Margins for the Power Painter Canvas.
-
Run the document.
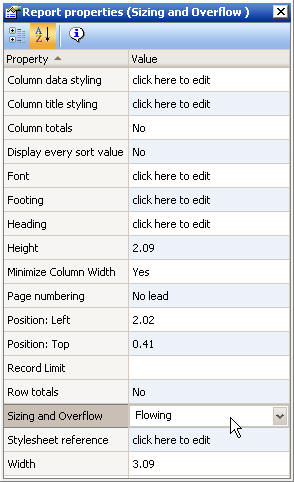
Note: If
the document contains multiple flowing reports and the reports overlap
at run time, you must set the relationship between the reports.
For more information about setting relationships, see How to Relate Surrounding Objects to a Report.
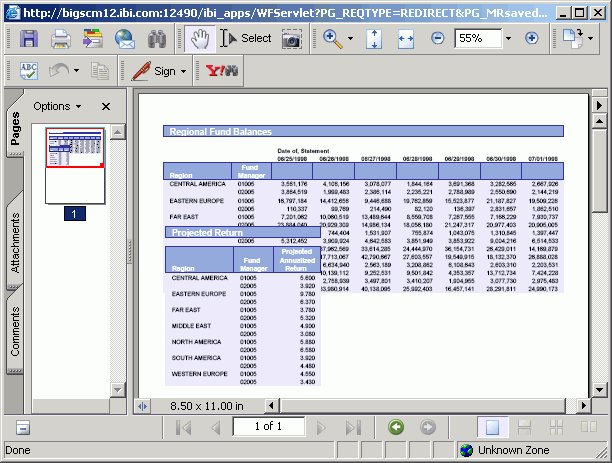
Note: If the
document contains a flowing report and a graph, and the graph overlaps
the report at run time, you must set the relationship between the
graph and the report. For more information, see How to Relate Surrounding Objects to a Report.
Procedure: How to Set Flow Margins for the Power Painter Canvas
You
can set the flow margins for the document, which become page margins
in the report output, when Sizing and Overflow is set to Flowing
for the report. Flow margins are set through the top and bottom
margins, and flowing reports utilize flow margins to ensure that
header and footer information is preserved in the output.
Note: There
is currently no method of controlling horizontal overflow.
-
Select the canvas from Power Painter.
-
From the Document properties palette, manually type in the Flow
margin: bottom value.
The flow margin bottom value sets the ending vertical coordinate
where a flowing report ends on each page.
-
From the Properties window, manually
type in the Flow margin: top value.
The flow
margin top value sets the beginning vertical coordinate where a flowing
report starts on each new page.
or
You can also set flow margins on the
canvas. To display flow margins, select Layout from the toolbar
menu and select Show Flow Margins.
Note: Flow
margins are indicated by blue lines that appear on the top and bottom
of the Power Painter canvas.
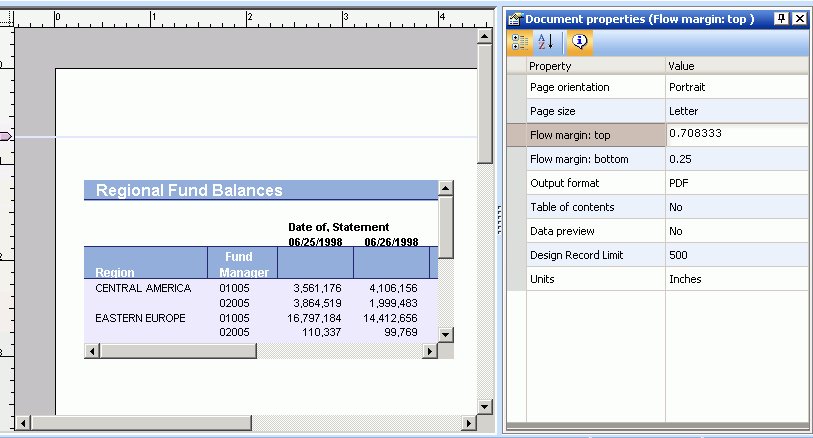
-
Adjust the objects on the canvas between the flow margins and
run the report.
The report fills each page between the flow margins until
it reaches the end. For example, in the image below the flow margin
was adjusted so that an image could be used as a header.