WebFOCUS Online Help > Creating Charts With Graph Tools > Customizing Graphs With the Graph Editor > Adding Chart Titles
How to: |
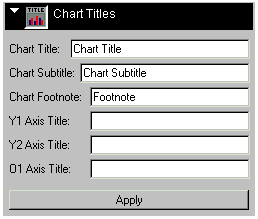
You can add and edit the titles that appear with a chart or graph. You can edit the chart title, chart subtitle, chart footnote, and axis titles.
The selections in this dialog add the following methods to the code that defines this chart:
Editor Field |
Method |
---|---|
Chart Title |
setTextString (getTitle(),"Title String"); |
Chart Subtitle |
setTextString (getSubtitle(),"Subtitle String "); |
Chart Footnote |
setTextString (getFootnote (),"Footnote String "); |
O1 Axis Title |
setTextString (getO1AxisTitle(),"O1 Axis Title"); |
O2 Axis Title (where applicable) |
setTextString (getO2AxisTitle(),"O2 Axis Title"); |
X1 Axis Title (where applicable) |
setTextString (getX1AxisTitle(),"X1 Axis Title"); |
Y1 Axis Title |
setTextString (getY1AxisTitle(),"Y1 Axis Title"); |
Y2 Axis Title |
setTextString (getY2AxisTitle(),"Y2 Axis Title"); |
Note: If the default display attribute of a chart title is false, the setDisplay() method is added to the code to enable the display of the defined title object.
Example:
setDisplay(getO2Title(),true); setDisplay(getO2Title(), false);
If you clear a title string, the setDisplay method will be added to the code to disable display of the cleared text object.
Example:
setDisplay(getO2Title(), false);
WebFOCUS |