WebFOCUS Online Help > Creating Charts With Graph Tools > Creating Graphs With Graph Assistant > Field Selection Tab in the Developer Studio Environment
Reference: |
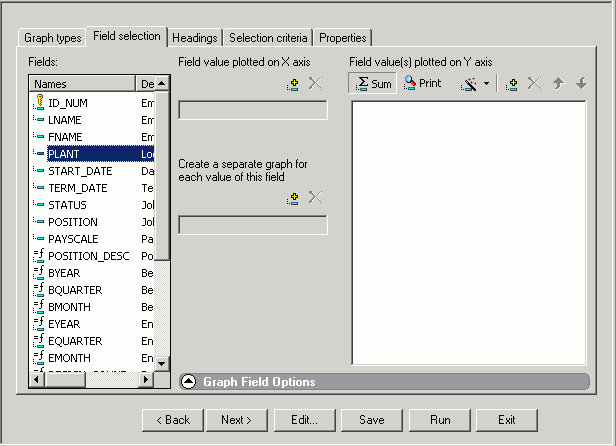
The following image shows the Field Selection tab in the Graph Assistant.
Displays a list of field names from the selected data source.
Lists the horizontal (X-axis) field that has been selected from the Fields window.
Lists the vertical (Y-axis) fields that have been added from the Fields window.
To move the position of the field within the graph, select the field in the Value (Y) Axis list and click the Up or Down button.
To delete a field, select the field in the Value (Y) Axis list and click the Delete button.
Lists the field that will generate a separate graph.
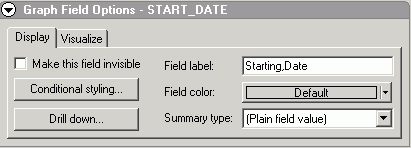
The following image shows the Display subtab for the Y-axis field name in the Field Selection tab.
For the Y-axis field name Display subtab:
Check to temporarily hide the display of a Y-axis field.
Click to open the conditional styling dialog box shown in the following image which you use to add conditional styling in a graph.
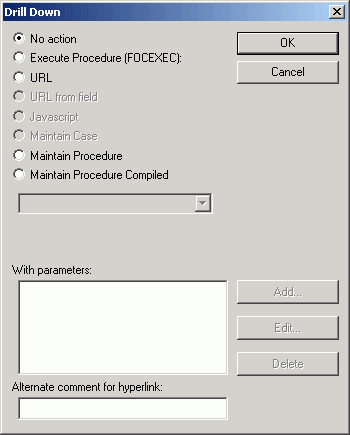
Click to open the drill down dialog box shown in the following image which you use to add drill down capability to a graph.
Is the default.
Lists procedures contained with Standard Reports. Use the drop-down list to click the procedure you want to execute.
Type the URL in the text box.
Drilling down to a Maintain procedure is only supported when the procedure is executed from a Web browser such as Internet Explorer.
If the procedure is compiled, select Maintain Procedure Compiled. (Consult your Maintain developer to determine if your procedure is compiled.)
Once a parameter is created, it is automatically added to this list box.
You can place other comments here.
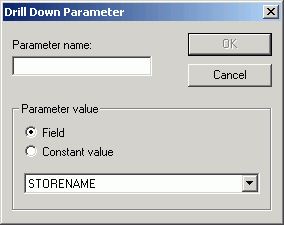
Click to open the drill down parameter dialog box shown in the following image.
Enter the parameter name you created in the drill-down procedure.
The parameter will be set to the corresponding value of the object the user drills down on in the specified field.
The parameter is set to the specified value.
Returns to the drill down dialog box. The parameter is added to the With parameters list box.
Lists the highlighted field selected from the Y-axis.
Select the display color for the field currently selected in the Y-axis value list.
Select a summary type for the Y-axis field selected in the Y-axis value(s) list.
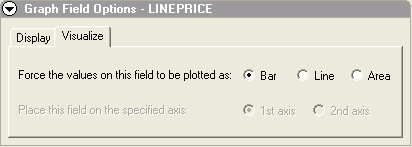
The following image shows the Visualize subtab for the Y-axis field name in the Field Selection tab.
For the Y-axis field name Visualize subtab:
Choose bar, line, or area.
Choose 1st axis or 2nd axis, for dual-axis graph types.
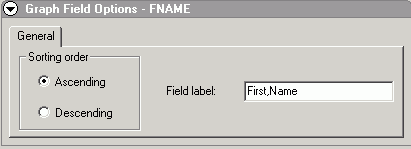
The following image shows the General subtab for the X-axis field name in the Field Selection tab.
For the X-axis field name:
Click ascending or descending.
Field name is entered.
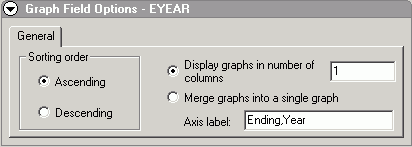
The following image shows the General subtab for the Separate Graph field name in the Field Selection tab.
For any additional graph field name(s):
Click ascending or descending.
Enter a number in the text box.
Click this option button to activate.
The field name is automatically entered in this text box.
| WebFOCUS |