Procedure: How to Select a Built-in Template from the Advanced Graph Assistant
-
Open the Advanced Graph Assistant.
Note: For details about opening the Advanced Graph Assistant, see Accessing Advanced Graph Assistant.
The Advanced Graph Assistant opens at the Chart type tab.
-
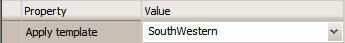
From the Properties window, select the Apply Template drop-down
list.
Tip: The Apply Template property also appears under the Chart Editor tab of the Advanced Graph Assistant.
-
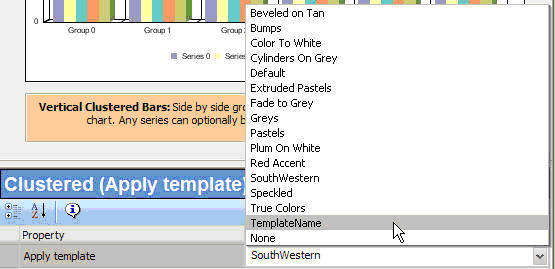
Select the template of your choice.
Note: The default template is SouthWestern.
The graph refreshes applying the template you selected.