WebFOCUS
Online Help > InfoAssist > Customizing and Styling Report Queries > Using Custom Reporting Features
Using Custom Reporting Features
You can use the following custom features when creating
report queries in InfoAssist.
- Rank - Inserts
a ranking column for By and Measure fields in a Report. For details,
see How to Rank Fields in a Report.
- Limit - Limits
the number of unique variables in a column. For details, see How to Limit the Variables of a Column in a Report.
- Page Breaks
- Starts a new page in the output when the primary sort field changes. For
details, see How to Add Page and Line Breaks to a Report.
- Line Breaks
- Inserts a line in the report output when the primary sort field
changes. For details, see How to Add Page and Line Breaks to a Report.
- Subtotal
- Inserts subtotals in the output for all numeric fields when the
primary sort field changes. For details, see How to Add Subtotals to a Report.
- Column Totals
- Inserts a grand total row at the bottom of the report to sum numeric data
in each column. For details, see How to Add Column Totals to a Report.
- Row Totals
- Inserts a grand total column to the right side of the report to
sum numeric data in each row. For details, see How to Add Row Totals to a Report.
- Sub Head
- Adds a subheading just below the column titles in the report output when
the primary sort field changes. For details, see How to Add Subheadings and Subfootings to a Report.
- Sub Foot
- Adds a subfooting at the end of the data on each page of the report output
when the primary sort field changes. For details, see How to Add Subheadings and Subfootings to a Report.
- Pop-up Titles
- Adds pop-up titles to report output when the mouse pointer hovers over
a column title. For details, see How to Add Pop-up Titles to a Report.
- Data Bars
- Adds data visualization bars to numeric data. For details, see How to Add Data Visualization Bars to a Report.
- Aggregation
- Displays numeric measure data using aggregation options other
than the default of Sum. For details, see How to Display Measure Data Using Aggregation Options in a Report.
- Repeat Sort
Values - Displays all repeated sort values instead of blanks after
the first instance of a new sort value appears in the report. The
default behavior is to display blanks after the first instance of
a new sort value. For details, see How to Display Repeated Sort Values in a Report.
- Recompute
- Recalculates the result of a Compute command. Recompute is similar to
Subtotal in that it recalculates only at the specified sort break.
For more details, see How to Recalculate the Result of a Compute Command.
Procedure: How to Rank Fields in a Report
You
can add rank columns to BY and Measure fields in a Report by using
the Rank button in the Sort group. Adding a rank column to a BY
field will insert a rank column immediately to the left of the field.
Adding a rank column to a Measure field will create a copy of the
column as a BY field and add a rank colum to the left of the new
BY field.
Note: The rank option can also be accessed
by right-clicking on a BY or Measure field and accessing the Rank
option through the context menu.
-
Select a By or Measure field in the Query Design pane.
The Field tab is displayed in the Control Panel.
-
Select Rank from the Sort group. A rank column
will now appear, as shown in the following image.
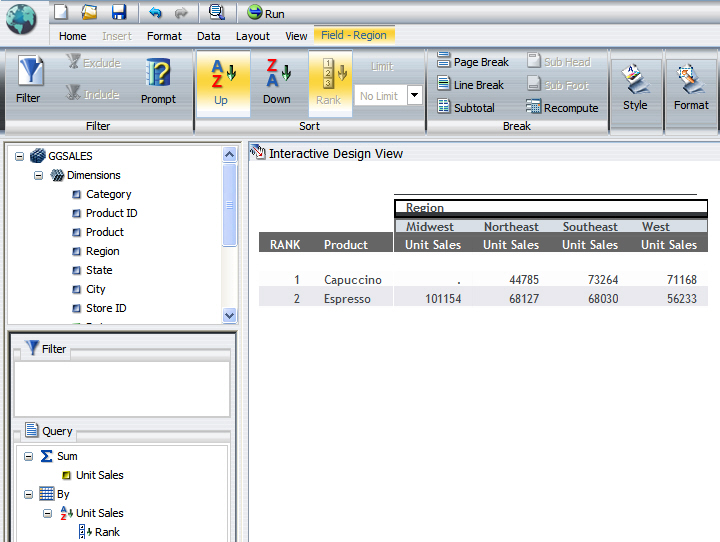
Note: The rank
column can now be edited and formatted like any other column, with
the following exceptions:
- The only formatting
that can be applied is Traffic Light Conditions.
- It cannot
be hidden.
- You cannot
insert breaks or a filter.
- No column
can be moved inbetween the rank column and the column it is ranking.
Procedure: How to Limit the Variables of a Column in a Report
You
can limit the number of unique variables that appear in a column
using the Limit drop-down menu available in the Sort group of the
Fields tab when a column is selected.
Note: The limit
option can also be accessed by right-clicking on a column and accessing
the Limit option through the context menu.
-
Select a By or Measure field in the Query Design pane.
The Field tab is displayed in the Control Panel.
-
Enter a number or select a number from the Limit drop-down
menu in the Sort group. The field will now be limited to the entered
number of unique values.
Procedure: How to Add Page and Line Breaks to a Report
You
can add page breaks and line breaks to report output for the primary
sort field.
-
Select a By (sort) field in the Query Design pane.
The Field tab is displayed in the Control Panel.
-
Select Page Break or Line Break from
the Break group.
-
Run the report.
If
you selected Page Break, a new page is created every time the value
of the primary sort field changes. Each page includes a new set
of column titles, as shown in the following image.
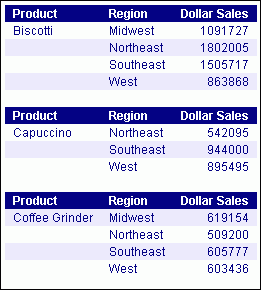
If
you selected Line Break, a new divider line is inserted in the report
output every time the value of the primary sort field changes, as
shown in the following image.
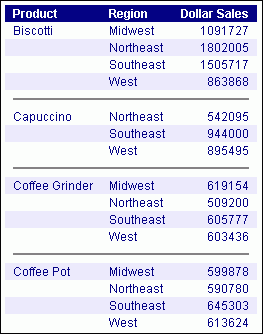
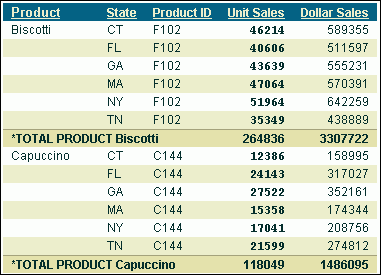
Procedure: How to Add Subtotals to a Report
-
Select a By (sort) field in the Query Design pane.
The Field tab is displayed in the Control Panel.
-
Select Subtotal from the Break group.
-
Run the report.
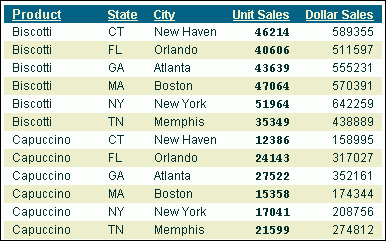
Selecting Subtotal inserts
a line, descriptive text (*TOTAL FIELD Value), and subtotals
for all numeric fields every time the value of the primary sort
field changes. The following image is an example of report output
when you select the Subtotal option.
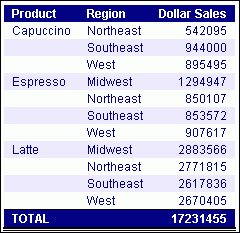
Procedure: How to Add Column Totals to a Report
-
Select the Home tab in the Control Panel.
-
Select Column Totals from the Report group.
-
Run the report.
Selecting Column
Totals adds a grand TOTAL row at the bottom of the report
that sums numeric data in each column, as shown in the following image.
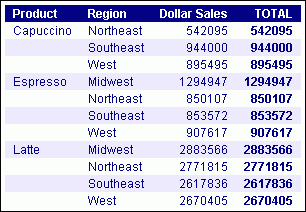
Procedure: How to Add Row Totals to a Report
-
Select the Home tab in the Control Panel.
-
Select Row Totals from the Report group.
-
Run the report.
Selecting Row
Totals adds a grand TOTAL column to the right side of
the report that sums numeric data in each row, as shown in the following image.
Procedure: How to Add Subheadings and Subfootings to a Report
You
can add subheadings and subfootings to report output for the primary
sort field.
-
Select a By (sort) field in the Query Design pane.
The Field tab is displayed in the Control Panel.
-
Select Sub Head or Sub Foot from
the Break group.
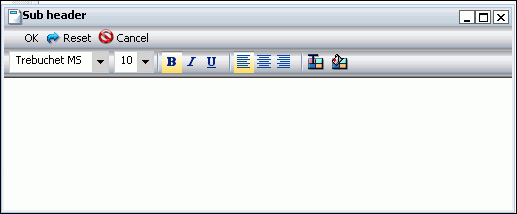
-
In the Sub header or Sub footer dialog box that opens, type
the desired text, style the text using the styling controls (if
desired), and click OK.
The following image shows the Sub header dialog box.
-
Run the report.
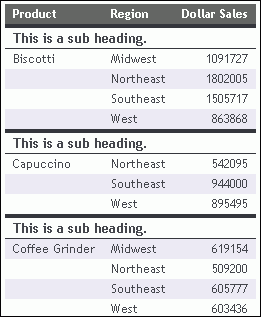
Subheadings
are displayed just below the column titles in the report output every
time the value of the primary sort field changes. Subfootings are
displayed at the end of the data on each page of the report output
every time the value of the primary sort field changes. The following
image shows how subheadings appear in the report output.
Procedure: How to Add Pop-up Titles to a Report
-
Select the Format tab in the Control
Panel.
-
Click Title Popup in the Features group.
-
Run the report.
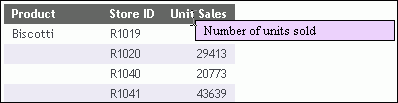
Selecting Title
Popup displays pop-up titles when the mouse pointer
hovers over any column title in the report output, as shown in the
following image.
Procedure: How to Add Data Visualization Bars to a Report
You
can add data visualization bars to the report output for a selected
numeric data source field.
-
Select the desired numeric data source field in the Query Design
pane.
The Field tab is displayed in the Control Panel.
-
Select Data Bars from the Specific group.
-
Run the report.
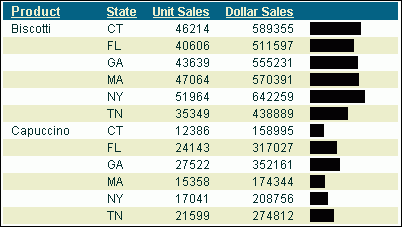
A
data visualization column is added to the right of the selected
numeric data source field to display values in each row. The column
uses horizontal bars that extend from left to right in varying lengths,
depending on the corresponding data values. The following image
is an example of report output when you select the Data Bars option.
Procedure: How to Display Measure Data Using Aggregation Options in a Report
You
can display numeric measure data using a variety of aggregation
type values other than the default of Sum.
-
Select the desired numeric measure data source field in the Query
Design pane.
The Field tab is displayed in the Control Panel.
-
Select Aggregation from the Specific
group, or right-click the selected measure field and select Aggregation Functions.
-
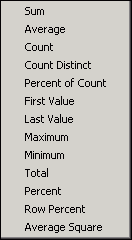
In the Aggregation Functions drop-down menu that opens, as
shown in the following image, the choices are Sum, Average, Count,
Count Distinct, Percent of Count, First Value, Last Value, Maximum,
Minimum, Total, Percent, Row Percent, and Average Square.
If
you change the Measure field container from Sum to Print, Count,
or List, it overrides all assigned aggregation type values.
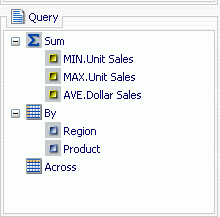
The
following image is an example of the MIN (minimum), MAX (maximum),
and AVE (average) aggregation prefix operators added to measure
fields in the Query Design pane.
-
Run the report.
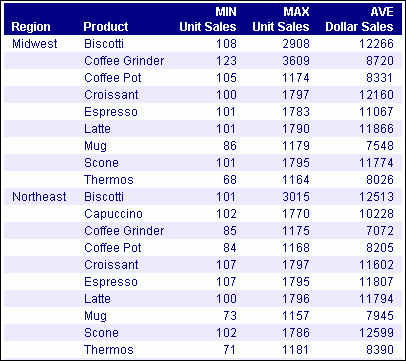
The following image is an example of report output produced
by assigning the Minimum, Maximum, and Average aggregation options
to measure fields in a query.
Procedure: How to Display Repeated Sort Values in a Report
-
Select the Format tab in the Control
Panel.
-
Click Repeat Sort Value in the Features
group.
-
Run the report.
When
you select Repeat Sort Value, all repeated sort values are displayed
in the report output, as shown in the following image. This option
overrides the default behavior, which displays blanks after the
first instance of each new sort value that appears in the report.
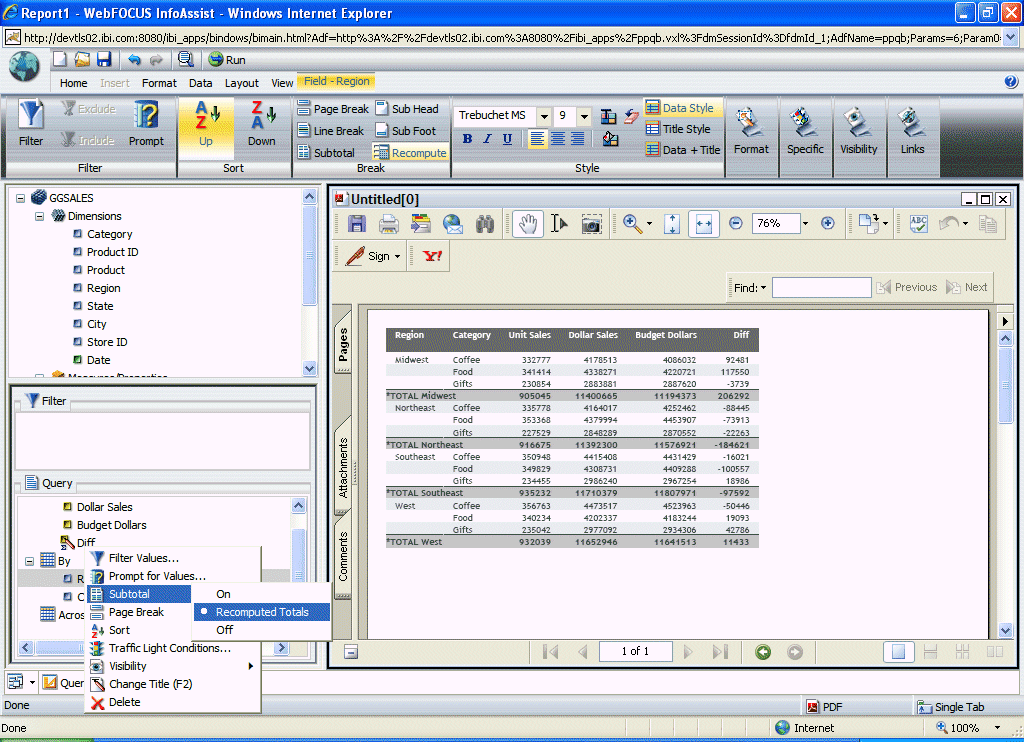
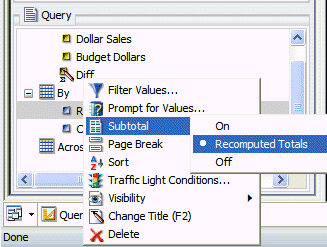
Procedure: How to Recalculate the Result of a Compute Command
-
Select a By (sort) field in the Query Design pane.
The Field tab is displayed in the Control Panel.
-
You can recalculate the result of a Compute command either by:
Selecting Recompute from the Break
group as shown in the following image.
Or,
selecting Recomputed Totals from the right-click
menu on a sort field as shown in the following image.
-
Run the report.
The following image shows a calculated field name Diff,
which is the difference between Dollars and Buddollars. This value
is then recomputed for each sort break on region. The recomputed
value is the difference between the totals for Dollars and Buddollars.