WebFOCUS Online Help > Creating Charts With Graph Tools > Creating Graphs With Graph Assistant > Headings Tab
The Headings tab shown in the following image, from the Managed Reporting environment, is used to create headings and footings. It has Page and Graph subtabs.
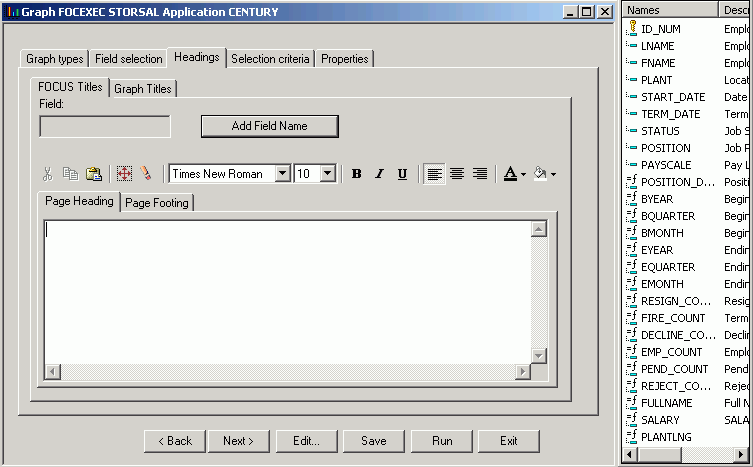
The following image shows the Graph Assistant Headings tab (FOCUS Titles).
Provides a list of all the fields in the current data source. Note that this is a separate window from the Graph Assistant.
The currently selected field appears in this box.
Enter the text for the heading in the Page Heading box.
Enter the text for the footing in the Page Footing box.
Use this to add a field to a heading or a footing.
Formatting tool bar
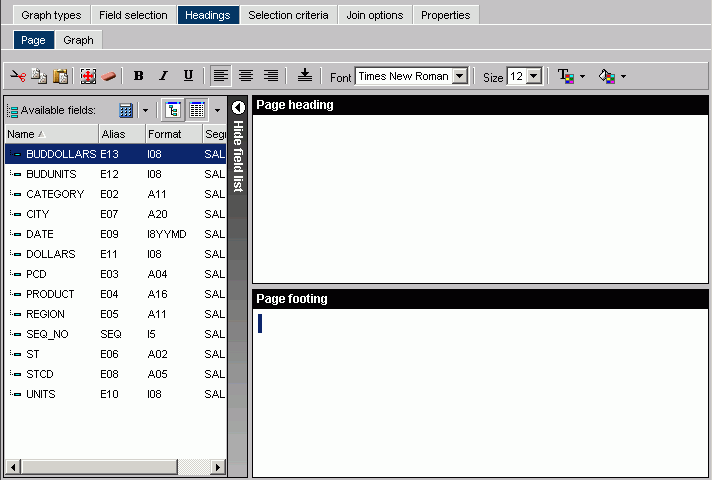
The Page subtab of the Headings tab shown in the following image is used to create report headings and footings.
Enter the text for the heading in the Page Heading box.
Enter the text for the footing in the Page Footing box.
Center aligns the selected text. The Center option is available for upward compatibility.
Formatting tool bar
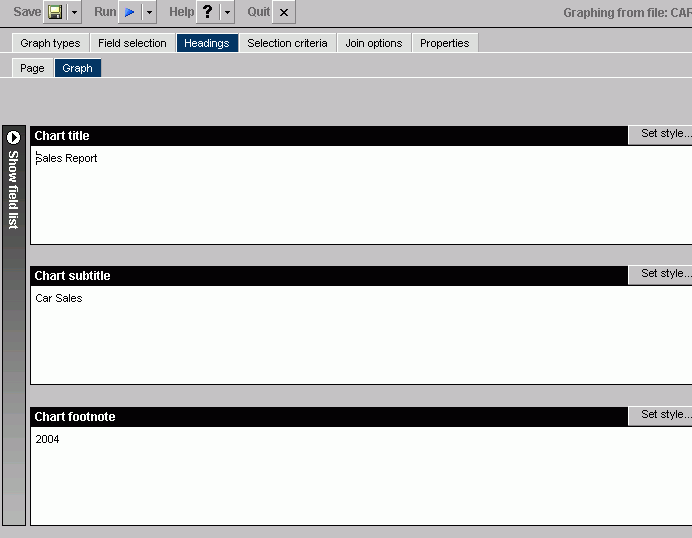
The Graph subtab of the Headings tab shown in the following image is used to create chart titles, subtitles, and footings.
Enter text for the chart title here. The chart title will appear in the graph output as well as in the title bar of your browser.
Enter text for the chart subtitle here.
Enter text for the chart footnote here.
To change the properties, click the Style Title, Style Subtitle, or Style Footnote button for the respective text box (Chart Title, Chart Subtitle, Chart Footnote). For details, see Chart Title, Subtitle, and Footnote Properties Dialog Box.
Insert a field in your heading or footing from the fields list.
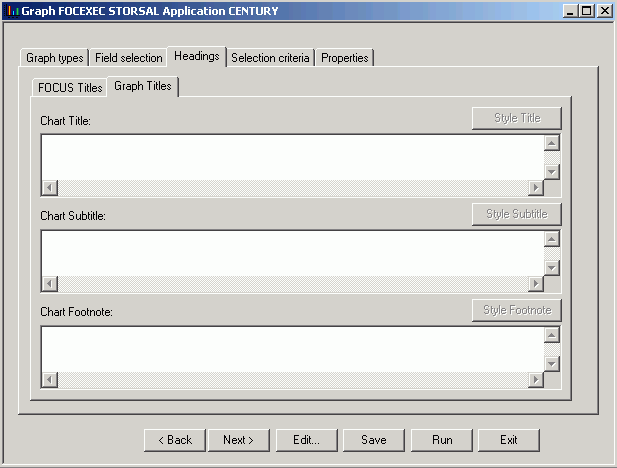
The following image shows the Graph Assistant Headings tab (Graph Titles).
Enter text for the chart title here. The chart title will appear in the graph output as well as in your browser's title bar.
Enter text for the chart subtitle here.
Enter text for the chart footnote here.
To change the font style or size, click the Style Title, Style Subtitle, or Style Footnote button for the respective text box.
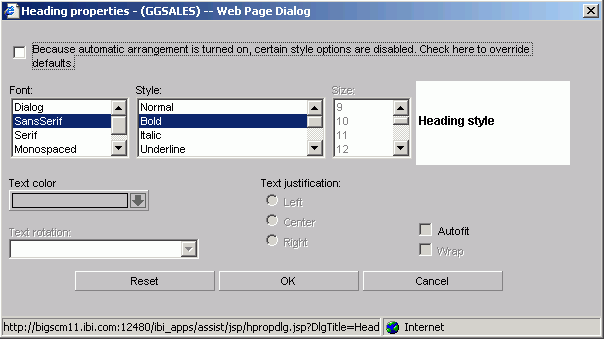
Click Settings in the Headings tab in the Chart Title, Chart Subtitle, and Footnote areas to open the Heading properties dialog box, from the Managed Reporting environment, as shown in the following image.
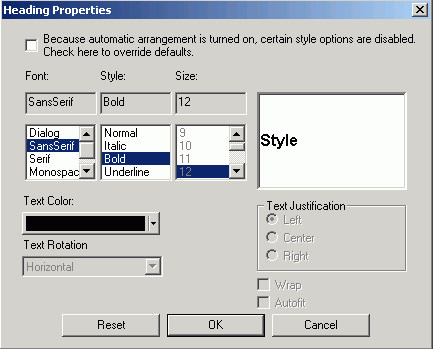
Click Settings in the Headings tab in the Chart Title, Chart Subtitle, and Footnote areas to open the Heading properties dialog box, from the Developer Studio environment, as shown in the following image.
Select the font type.
Select the font style.
Select the text size.
Select a text color from the drop-down list.
Horizontal. Displays text in a horizontal orientation that reads left to right.
Vertical - Bottom to top. Displays text in a vertical orientation that reads from bottom to top.
Vertical - Top to bottom. Displays text in a vertical orientation that reads from top to bottom.
Indicate whether the text will be left, center, or right justified.
Checked. Automatically adjusts the heading font size to fit the graph and disables the Size drop-down list.
Unchecked. This is the default. To select a different heading font size, select the font size in the Size drop-down list.
Check this box to wrap the text.
| WebFOCUS |