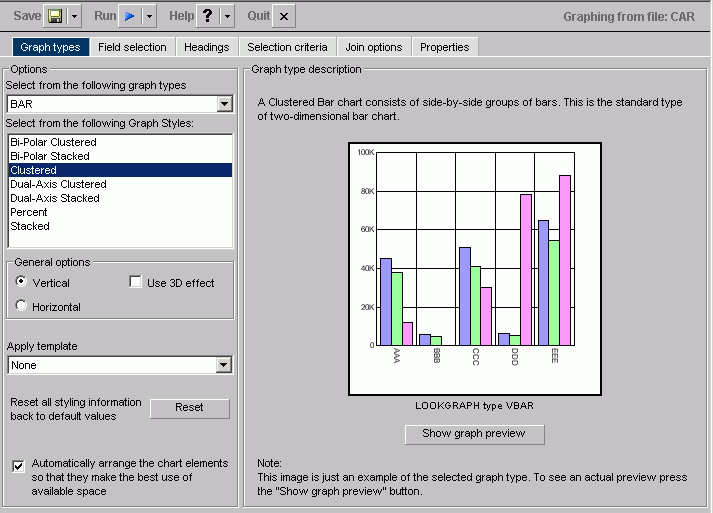
The following image shows the Graph types tab, in the Managed Reporting environment with a cluster bar chart.
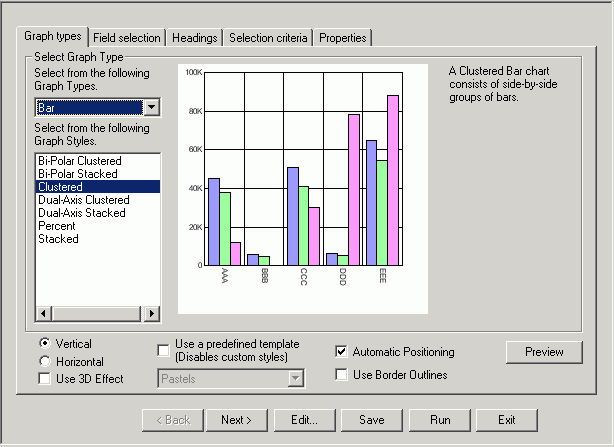
The following image shows the Graph types tab, in the Developer Studio environment with a cluster bar chart.
In the Select Graph type component:
- Select from the following graph types
-
Displays Line, Bar, Pie, Scatter, Area, 3D, Bubble, Polar, Radar, Spectral Map, Stock, Histogram, Multi-Y, Waterfall, and Miscellaneous graph types.
- Select from the following Graph Styles
-
Displays several graph styles customized for each graph type.
General options:
- Vertical
-
Displays the data vertically, along the Y-axis.
- Horizontal
-
Displays the data horizontally, along the X-axis.
- Use 3D effect
-
Applies a three-dimensional look to either the vertical or horizontal data.
- Apply/Use a predefined template
-
Note: This option appears as Apply in the Managed Reporting environment, and as Use a predefined template in the Developer Studio environment of the Graph Assistant.
Displays the Pastels, Beveled on Tan, Color to White, Cylinder on Grey, Fade to Grey, Bumps, Greys, Plum on White, Red Accent, Speckled templates, and True colors.
- Reset button
-
Resets all styling information back to the default values.
- Automatic Positioning/Automatically arrange the chart elements so that they make the best use of available space
-
Note: This option appears as Automatic Positioning in the Developer Studio environment, and as Automatically arrange the chart elements so that they make the best use of available space in the Managed Reporting environment of the Graph Assistant.
Specify this option with a check in the check box.
The Graph type description component of the Graph Types tab includes a description of the Graph type and style you have chosen, along with a sample graph. In addition, you have the following options:
- Show Graph Preview button/Preview button
-
Note: This option appears as Show Graph Preview button in the Managed Reporting environment, and as Preview button in the Developer Studio environment of the Graph Assistant.
Displays the actual graph in a separate window with the options you specified.
- Update button
-
Updates a graph after you make changes.
- Automatic Update check box
-
Check to have your graph automatically updated each time a change is made.

